Psychrometric Chart and Air Characteristics
A psychrometric chart presents physical and thermal properties of moist air in a graphical form. It can be very helpful in troubleshooting and finding solutions to greenhouse or livestock building environmental problems. Understanding psychrometric charts can help you visualize environmental control concepts, such as why heated air can hold more moisture or, conversely, how allowing moist air to cool will result in condensation. This article explains how characteristics of moist air are used in a psychrometric chart. Three examples are used to illustrate typical chart use and interpretation. Properties of moist air are explained in the Definitions section below for your reference during the following discussions.
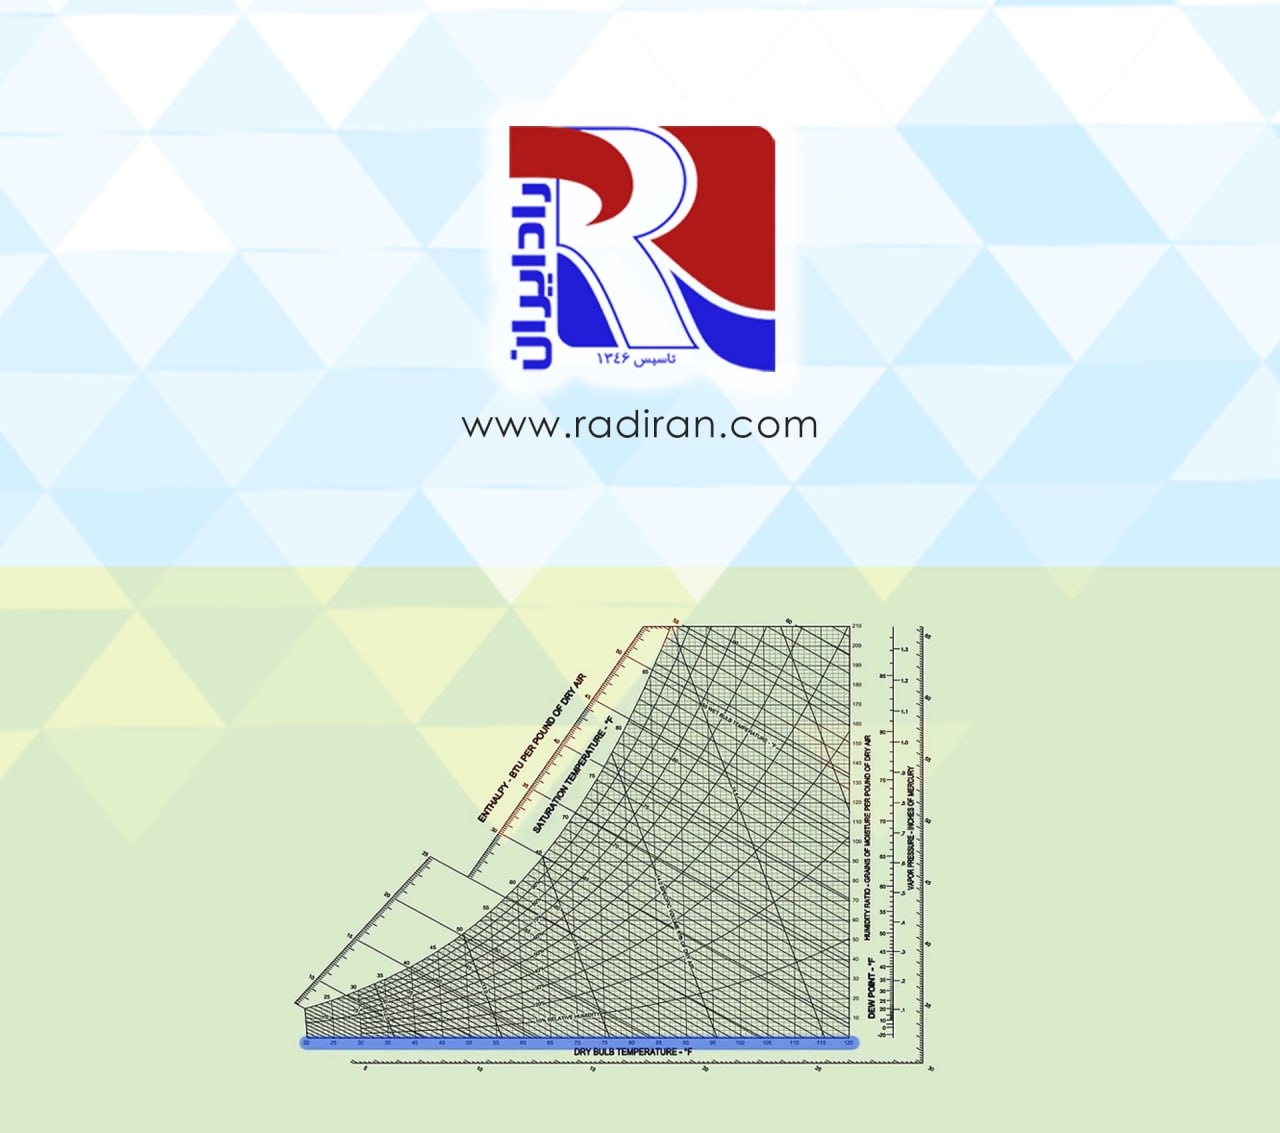
Psychrometric charts are available in various pressure and temperature ranges. Figure 1, is for standard atmospheric pressure (14.7 psi) and temperatures of 30° to 120°F, which is adequate for most greenhouse or livestock housing applications. Psychrometric properties also are available as data tables, equations, and slide rulers.
A psychrometric chart packs a lot of information into an odd-shaped graph. If we consider the components piece by piece, the usefulness of the chart will be clearer. Boundaries of the psychrometric chart are a dry-bulb temperature scale on the horizontal axis, a humidity ratio (moisture content) scale on the vertical axis, and an upper curved boundary which represents saturated air or 100-percent moisture holding capacity.