A detailed explanation of the psychrometric chart and the properties of air – Part II
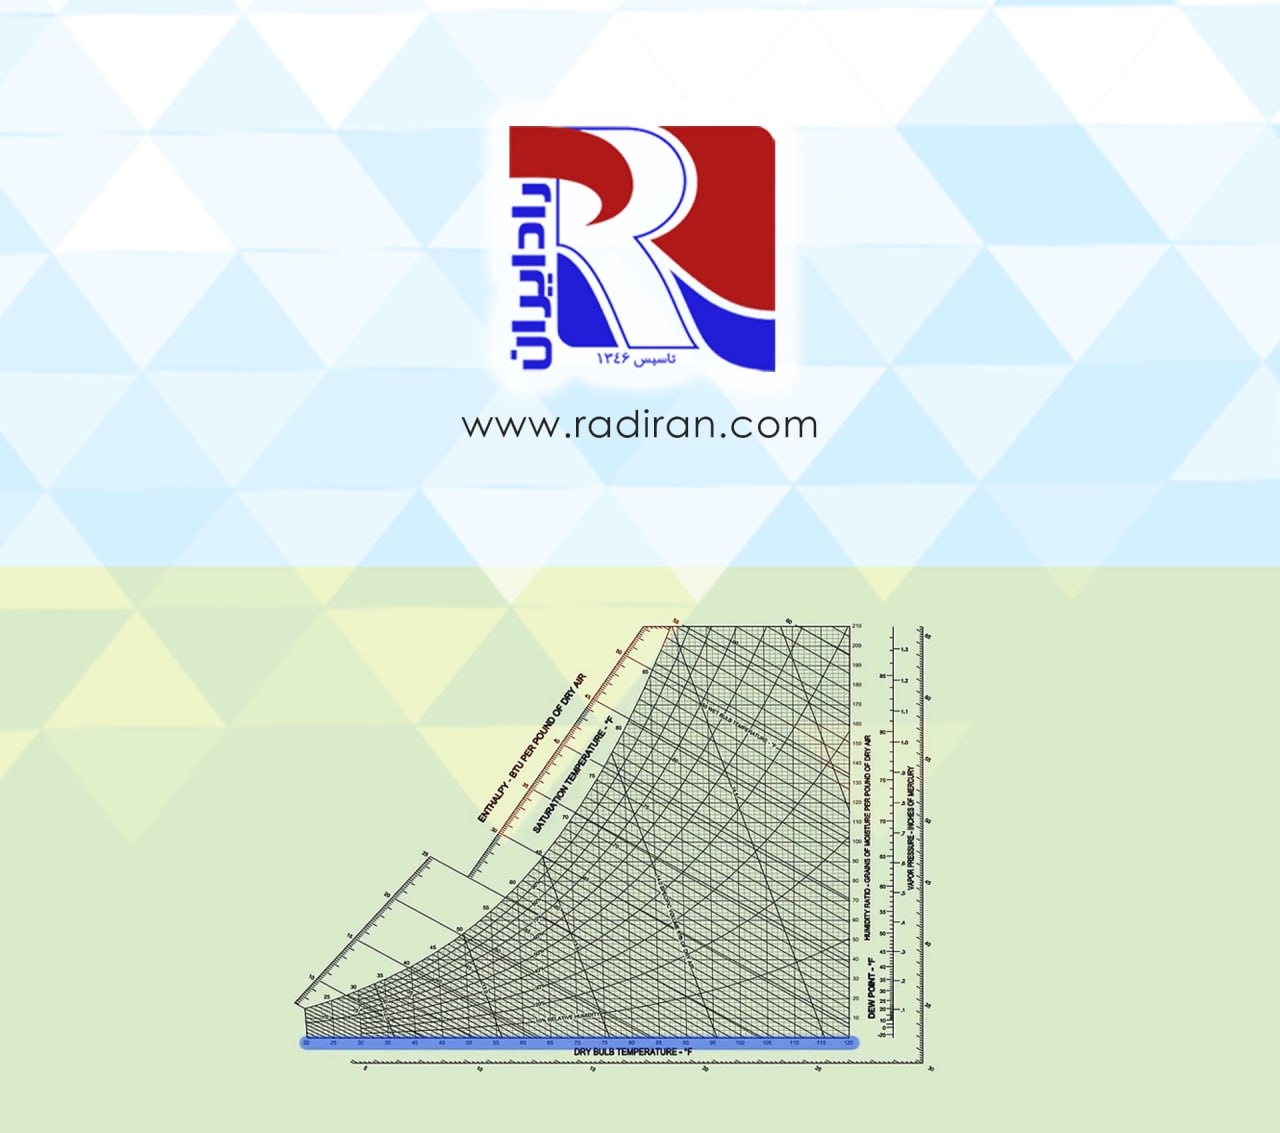
The chart shows other important moist air properties as diagrammed in Figure 2: wet-bulb temperature; enthalpy; dewpoint or saturation temperature; relative humidity; and specific volume. See the Definitions section for an explanation of these terms. Moist air can be described by finding the intersection of any two of these properties. This is called a “state point.” From the state point all the other properties can be read. The key is to determine which interest. Some practice with examples will help. Use Figures 2 and 3 with the psychrometric chart in Figure 1 to verify whether you can find each air property.
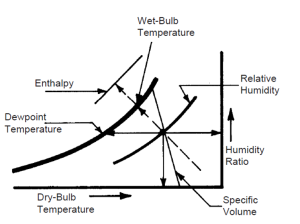
Figure 2. Properties of moist air on a psychrometric chart. Wet-bulb temperature and enthalpy use the same chart line but values are read off seperate scales.
An understanding of the shape and use of the psychrometric chart will help you diagnose air temperature and humidity problems. Note that cooler air (located along the lower, left region of the chart) will not hold as much moisture (as seen on the y-axis’ humidity ratio) as warm air (located along right side of chart). A rule of thumb for inside typical greenhouses or animal buildings during winter conditions is that a 10°F rise in air temperature can decrease relative humidity 20 percent. Use of a psychrometric chart will show that this is roughly true. For example, to decrease relative humidity in a winter greenhouse during a critical time period, we could heat the air. Use of Psychrometric Chart in Greenhouse and Barn
Example 1 – Find Air Properties
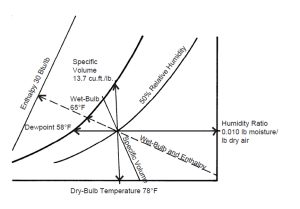
A sling psychrometer* gives a dry-bulb temperature of 78°F and a wet-bulb temperature of 65°F. Determine other moist air properties from this information. Two useful air properties for environmental analysis in agricultural buildings would be relative humidity and dewpoint temperature. Relative humidity is an indicator of how much moisture is in the air compared to desirable moisture conditions, and dewpoint temperature indicates when condensation problems would occur should the (dry-bulb) temperature drop.
Find the intersection of the two known properties, dry-bulb and wet-bulb temperatures, on the psychrometric chart, Figure 1. The dry-bulb temperature is located along the bottom horizontal axis. Find the line for 78°F, which runs vertically through the chart. Wet-bulb temperature is located along diagonal dotted lines leading to scale readings at the upper, curved boundary marked “saturation temperature.” The intersection of the vertical 78°F dry-bulb line and the diagonal 65°F wet-bulb line has now established a state point for the measured air. Now read relative humidity as 50 percent (curving line running from left to right up through the chart) and dewpoint temperature as 58°F (follow horizontal line, moving left, toward the curved upper boundary of saturation temperatures). This example is shown in Figure 3 so you may check your work.